
1. Introduction
The Pradhan Mantri Formalization of Micro Food Processing Enterprises Scheme (PMFME) provides Credit Linked Subsidy to Individuals / Proprietorship / Partnership/ FPOs/ NGOs/ Cooperatives/ SHGs/ Pvt. Ltd. Co. would be provided credit-linked capital subsidy @35% of the eligible project cost - maximum of Rs. 10.0 lakhs per unit for upgradation or setting up of new units. Seed Capital for SHGs : Seed capital @ Rs. 40,000/- per member of SHG for working capital and purchase of small tools maximum up to 4 Lakhs per SHG. Seed Capital given as grant to the SHG Federation by SRLM/SULM through SNA for loan to the members of SHGs.
Common Infrastructure: The Groups - FPOs/ FPCs/ Cooperatives/ SHG and its federation/ Govt. Agencies - established or propose to establish food processing line along with common infrastructure/ Value chain/ incubation centers would be provided credit linked capital subsidy @35% of the eligible project cost (Rs. 10 Cr) with a maximum of Rs. 3.00 Crore
ODOP: One District One Product (ODOP) approach to reap the benefit of scale in terms of procurement of inputs, availing common services and marketing of products. It aims to provide the framework for value chain development and alignment of support infrastructure. ODOP approved for 713 districts in 35 States/UTs with 137 unique products.
Marketing & Branding: The scheme provides 50% financial grant for Branding and Marketing Support to groups of FPOs/ SHGs/ Cooperatives or a SPV of micro food processing enterprises to promote their existing or proposed brands to market their processed food products under the scheme.
Capacity Building: The Capacity Building component under PMFME Scheme envisages to provide training on Food Processing Entrepreneurship Development Programme to the PMFME beneficiaries. (GOI, 2024).
2. Review of the Literature
The scheme provides 2,00,000 FPOs / SHGs/Cooperatives and working micro enterprises to be directly benefited and expected to generate 9 lakhs skilled and semiskilled jobs to be implemented over a five-year period from 2020-21 to 2024-25. The Cluster Development Approach is implemented on perishable items to minimize cost and maximize profit. (GOI, 2024)
The Micro and Small enterprise (MSE) sector including food products occupies a significant role in the total manufacturing sector of India, and Tamil Nadu in particular. Tamil Nadu has been in the forefront, with a pro-active policy to stimulate the growth of this sector. (Bhaskaran E. , 2008). Government policy on CDA by intervention in interrelationships not only benefited Chennai Auto Cluster in general but also Chennai Auto Components Industries in particular (Bhaskaran E. , 2011). There is increase in technical efficiency of not only Chennai auto cluster in general but also Chennai auto components industries in particular. (Bhaskaran E. , 2012). The technical efficiency of Lean Manufacturing Cluster companies also increases significantly. (Bhaskaran E. , 2012). For inclusive growth and sustainable development, the inefficient ACC should increase their turnover and exports, as decrease in no. of enterprises and employment is practically not possible. Moreover, for sustainable development, the ACC should strengthen infrastructure interrelationships, technology interrelationships, procurement interrelationships, production interrelationships and marketing interrelationships to increase productivity and efficiency to compete in the world market. (Bhaskaran E. , 2013)
Sustainable development, the TC should strengthen infrastructure interrelationships, technology interrelationships, procurement interrelationships, production interrelationships and marketing interrelationships to decrease cost, increase productivity and efficiency to compete in the world market. (Bhaskaran E. , 2013). Moreover, for sustainable development, the cluster should strengthen infrastructure, technology, procurement, production and marketing interrelationships to decrease costs and to increase productivity and efficiency to compete in the indigenous and export market. (Bhaskaran E. , 2014). Chassis design and center of Gravity is calculated and the Brake is kept in the Handle Bar. (Bhaskaran E. , 2015). This Cluster Development Approach (CDA) model can be implemented in industries of under developed and developing countries for cost reduction and productivity increase. (Bhaskaran E. , 2016)
Moreover for sustainable development, they should adopt cluster development approach, so that infrastructure interrelationships, technology interrelationships, procurement interrelationships, production interrelationships and marketing interrelationships will take place among CNSL manufacturers to decrease cost, increase quality, productivity and efficiency to compete in the world market. (Bhaskaran E. , 2017). The Chennai Automotive Industry Cluster Model, demonstrates the fact that industrial units have utilized the Physical Infrastructure and Centralized Facilities by adopting the CDA. (Bhaskaran E. , 2018). Moreover, for sustainable development, the EI should strengthen infrastructure interrelationships, technology interrelationships, procurement interrelationships, production interrelationships and marketing interrelationships to decrease costs and to increase productivity and efficiency to compete in the indigenous and export market (Bhaskaran E. , 2019). Moreover, for sustainable development, the SSIC should strengthen infrastructure, technology, procurement, production and marketing interrelationships to decrease costs, and to increase productivity and efficiency to compete in the indigenous and export markets. (Bhaskaran E. , 2020). The Women Ready Made Garments Cluster still needs to tap export market to compete in the global market. (Bhaskaran E. , 2020). The interrelationships / cluster approach made Chennai Heavy Engineering Enterprises and cluster members make use of resources like infrastructure, procurement, technology, production and marketing successfully. (Bhaskaran E. , 2021). The cluster approach has been beneficial to the Paddy and Rice Mill Cluster members, by enabling their utilization of better infrastructure, procurement, technology, production and marketing technologies. (Bhaskaran E. , 2021). The interrelationships because of the cluster approach enables members make use of infrastructure, procurement, technology, production, and marketing successfully. (Bhaskaran E. , 2022). There is an increase in the number of units, employment, production, and exports after adopting the Cluster Development Approach, leading to an increase in productivity, which is expected to continue well into the future. (Bhaskaran E. , 2022)
The costs of marketing, infrastructure development, human resources, raw material and production will decrease and there will be an increase in the profit/turnover. (Bhaskaran E. , 2022). By adopting a CDA productivity of Paramakudi Engineering Cluster is increased and also competitiveness of the enterprises in the cluster is increased to move up in the value chain. Due to CDA, MSEs in Paramakudi Engineering Cluster have adopted smart and sustainable manufacturing to reduce cost and increase profit. (Bhaskaran E. , 2023). Recommendations include that further trade agreements should be made with other untapped countries to increase exports of India and that the Government of India and Government of Tamil Nadu should create cluster policies based on export consortia variables. (Bhaskaran E. , 2023). The workforce needs further improvement for one firm, whereas the other three are highly efficient. (Bhaskaran E. , 2023)
Financial inclusion in industrial clusters is the need of the hour, which is already underway, in the form of grants from the Government of India and Tamil Nadu, Cluster Development Programmes, SPV contribution and bank loans to improve productivity and reduce costs, and common facility centres in clusters. (Bhaskaran E. , 2023). The Government of India and the concerned state governments implement the MSME Mart and GeM for MSME clusters in India to reduce the costs of production and marketing and increase profits, which allows MSMEs to compete in the domestic and international markets through ecommerce. (Bhaskaran E. , 2023). The findings indicate that in order to achieve SDGs 8 and 9, there is need for more decent work, economic growth, industry, innovation, and infrastructure in the industrial clusters. (Bhaskaran E. , 2023). There is an increase in number of units, employment, production and turnover after CDA when compared to before CDA, which leads to an increase in productivity thereby Sustainable Development Goals of 1, 4, 5, 8 and 9 are achieved. (Bhaskaran E. , 2024) Governments of India and Tamil Nadu, and the SPV of the Leather cluster have been coordinating with each other to mitigate climate change in the leather sector by installing common effluent treatment plants, obtaining the Leather Working Group and the Zero Effect and Zero-Defect certifications, and achieving Sustainable Development Goal 13 on Climate Action and Change. (Bhaskaran E. , 2024)
Aims and Objectives
3. Research Methods and Data
The methodology adopted is collection of secondary data from Government of India website of PMFME Scheme and other State Government websites. (GOI, 2024)
The data were analysed using SPSS, AMOS and Structural Equation Modelling by involving Moderator and Mediating variable and find the direct and indirect effect and also finding the business analytics techniques like Descriptive Analysis, Diagnostic Analysis, Correlation Analysis, Regression Analysis, Inferential Analysis Predictive Analysis, Prescriptive Analysis and Decision Analysis of PMFME Scheme. The Conceptual Framework is given in figure 1.
| Input Variables | Government of India Intervention | Output Variables |
| Applications Submitted (As) | Government Policy (Gp) | |
| Applications Forwarded to Banks (Af) | Government Resource (Gr) | Loan Disbursed (Ld) |
| Loan Sanctioned (Ls) | Credit-linked capital subsidy @35% of the eligible project cost - maximum of Rs. 10.0 lakhs |
Source: Developed by researcher.
Figure 1 Conceptual Framework.
4. Results and Discussion
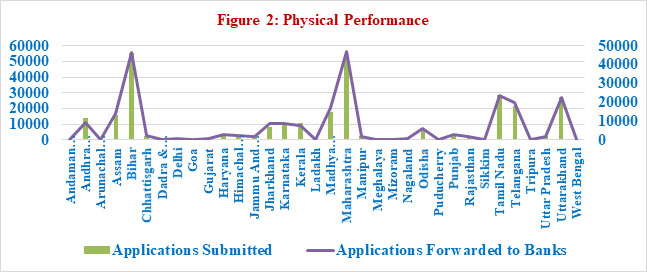
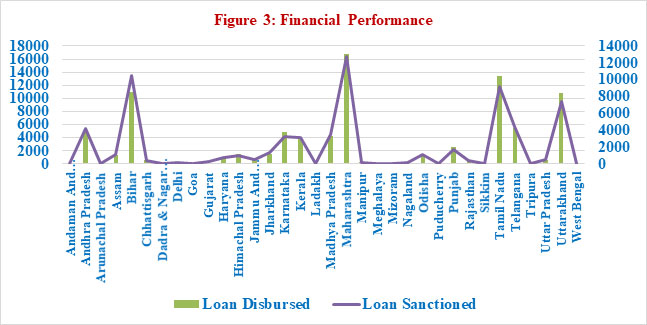
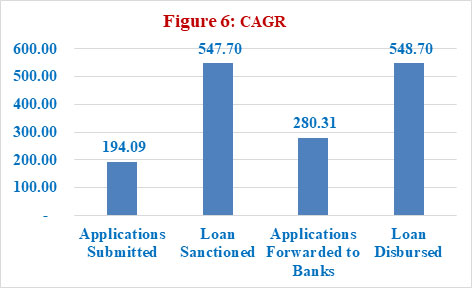
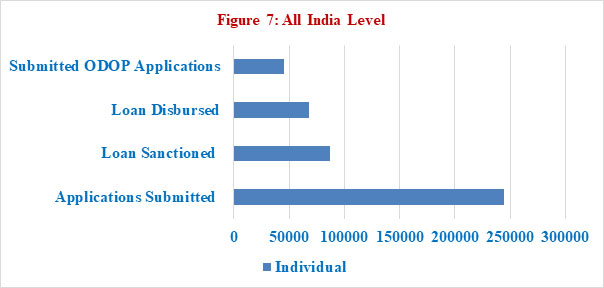
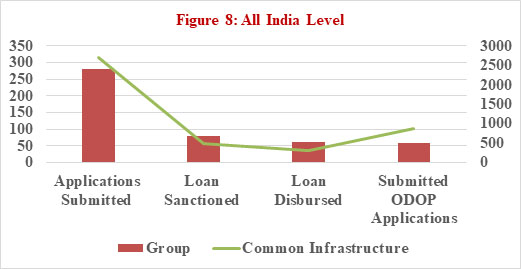
The study results in performance of PMFME on all India basis and also in Tamil Nadu. (GOTN, 2021). The physical and financial performance of PMFME Scheme in India is given in figure 2 and 3.
Source: (GOI, 2024)
Source: (GOI, 2024)
Source: (GOI, 2024)
Source: (GOI, 2024)
Source: (GOI, 2024)
Source: (GOI, 2024)
Source: (GOI, 2024)
Business Analytics / Descriptive Analytics
The Descriptive Analysis is given in table 1.
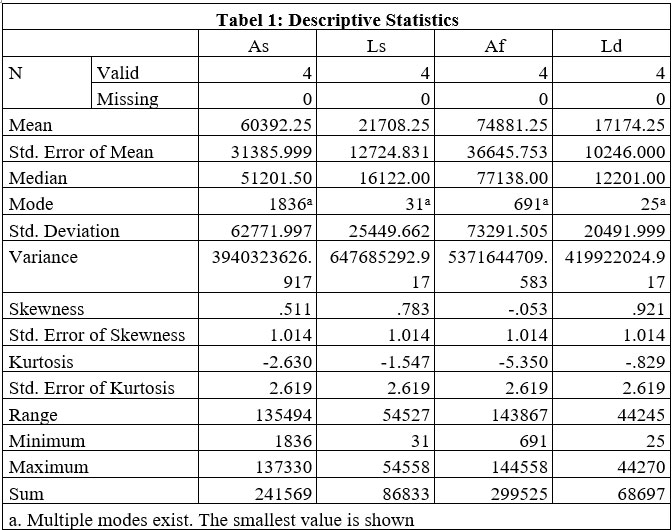
Source: Computed data
Correlation Analysis
Correlation Analysis is given in Table 2.
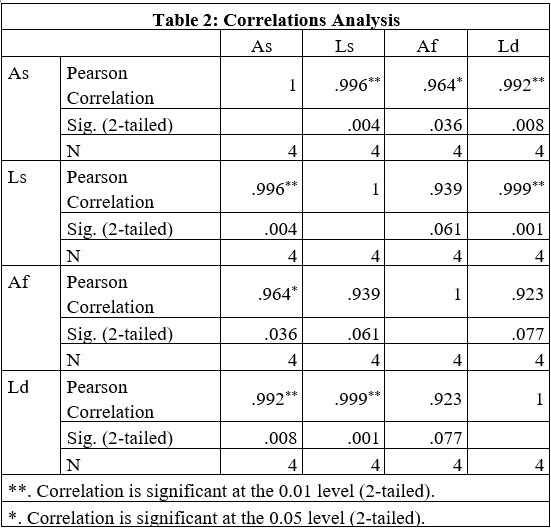
Source: Computed data
As per Correlation Analysis in table 2, it is observed that there is strong relationship between Loan application submitted by entrepreneurs, Loan applications forwarded to banks, Loan Sanctioned by banks and Loan Disbursed by banks.
Predictive Analysis / Regression Analysis
The regression analysis and the regression equation are given in equation 1.
Ld = 257.95 + 0.896 Ls – 0.034 Af, where p = 0.011<0.05, R2 = 1.00 …. [1]
Inferential Analysis
For one unit increase in Loan Sanction there is 0.896 units increase in loan disbursement by banks.
Null Hypothesis 1: There is no significance difference between Loan Sanction and loan disbursement.
Alternate Hypothesis 1: There is significance difference between Loan Sanction and loan disbursement. As per equation [1] the regression coefficient is 1.00 and as per table 4 of the correlation analysis the correlation coefficient is 0.999. Hence the null hypothesis is rejected and alternate hypothesis is accepted and it can be concluded that there is significance difference between Loan Sanction and loan disbursement.
Null Hypothesis 2: There is no significance difference between applications filed (Af) with banks and loan disbursement (Ld)
Alternate Hypothesis 2: There is significance difference between applications filed (Af) with banks and loan disbursement (Ld)
However, there is no significance difference between applications filed (Af) with banks and loan disbursement (Ld).
The regression analysis and the regression equation are given in equation 2.
Ld = -288.92 + 0.804 Ls, where p = 0.001<0.05, R2 = 0.998 …. [2]
The regression analysis and the regression equation are given in equation 3.
Ls = -2697.513 + 0.326 Af, where p = 0.061>0.05, R2 = 0.881 …. [3]
The regression analysis and the regression equation are given in equation 4.
Ld = -2158.217 + 0.258 Af, where p = 0.077>0.05, R2 = 0.853 …. [4]
Trend Analysis / Prescriptive Analysis
As = -58198.00 + 47436.10 Tt, where p = 0.024 <0.05, R2 = 0.952 …. [5]
As per equation [5] it implies that an annual average increase in Application Submitted by entrepreneurs is 47,436.
Ls = -25625.50 + 18933.50 Tt, where p = 0.04 < 0.05, R2 = 0.922 …. [6]
As per equation [6] it reveals that an annual average increase in Loan sanctioned by banks is 18,933.
Af = -59818.50 + 53879.90 Tt, where p = 0.051 <0.05, R2 = 0.901 …. [7]
As per equation [7] it exposes that an annual average increase in Application forwarded to banks is 53,880.
As = -20779.50 + 15181.50 Tt, where p = 0.044 <0.05, R2 = 0.915 …. [8]
As per equation [8] it shows that an annual average increase in Application submitted by entrepreneurs is 15,182.
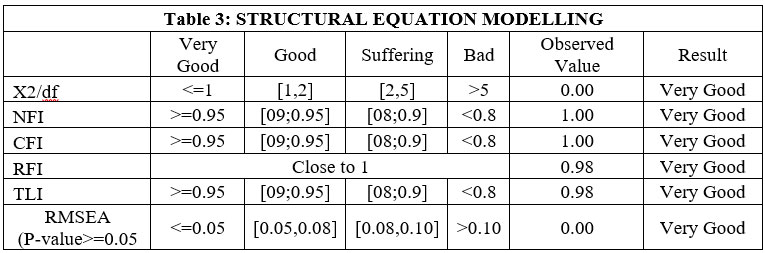
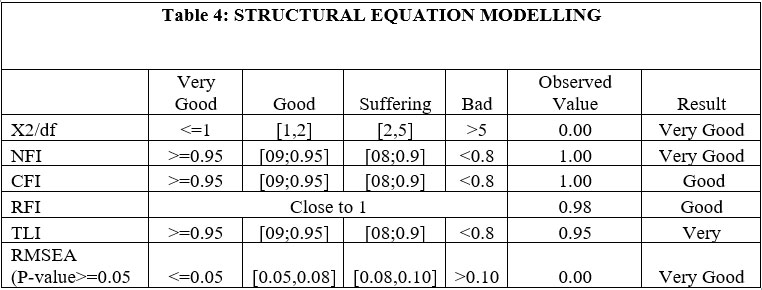
Structural Equation Modelling / Decision Analysis
Moderator Analysis
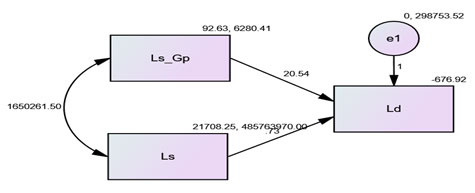
Source: Computed data
Figure 9: Moderator Analysis
Ld = -676.92 + 0.735 Ls + 20.544 Ls_Gp [ p = 0.031 < 0.05, R2 = 0.999]
Source: Computed data
Mediation Analysis
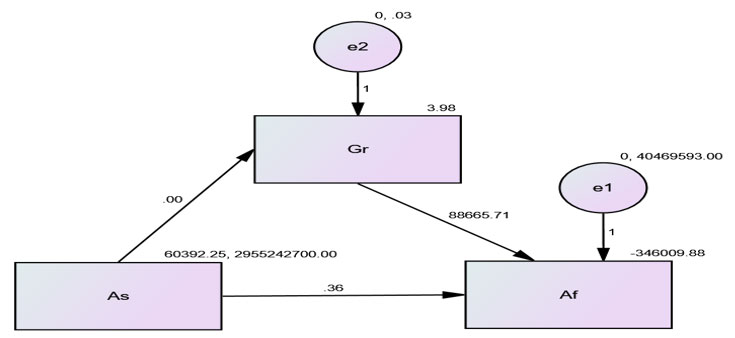
Source: Computed data
Figure 10: Mediation Analysis
Source: Computed data
5. Conclusion and Future directions
PMFME is flagship scheme of Government of India and all State Governments in India. A study was conducted on the physical and financial performance and also Government intervention on policy and resource allocation in the form of credit linked capital subsidy @35% of the eligible project cost up to maximum of Rs. 10.0 lakhs. It is found that the percentage gap between application submitted and applications forwarded to banks is to reduced. All applications submitted by entrepreneurs should be forwarded to banks after scrutinizing and helping them to apply again through District Resource Persons. From the analysis it is revealed that the applications which was forwarded to banks needs 100% sanction but it is not done by banks and some of the applications are rejected due to noncompliance on technical feasibility and financial viability and also by CIBIL Score. The banks should educate entrepreneurs and ask them to apply again. It also exposes those whatever applications sanctioned by banks is not 100% disbursed. To conclude, Banks should disburse it quickly whatever sanction given as per RBI norms. Entrepreneurs should form Cluster under Section 8 company get funding from Government of India under SFRUTI or MSE-CDP Scheme and should adopt Cluster Development Approach to reduce cost and maximize profit.
Future Directions:
The study is conducted in all India Level and future directions are to study State wise in India so as to study the individual State model using Cluster Development Approach and Business Analytics Models for cost minimization and profit maximization of individual / group of food processing enterprises.
ACKNOWLEDGEMENT
The author acknowledges Department of Industries and Commerce, Government of Tamil Nadu for sending him for UNIDO’s Cluster Development Agent (CDA) training at EDII, Ahmedabad sponsored by UNIDO, New Delhi and acknowledges Tamil Nadu Small Industries Development Corporation (TANSIDCO) for guidance and also acknowledges University of Madras for giving Ph.D. on Industrial Cluster Development Approach in Management Sciences.
References
Disclaimer : The opinions expressed within this interview are the personal opinions of the interviewee. The facts and opinions appearing in the answers do not reflect the views of Indiastat or the interviewer. Indiastat does not hold any responsibility or liability for the same.
Fresh Investment Grew by 9.9% in Q3/FY25... Read more
.png)


.png)